Over the past fifteen years, the Federal Reserve System has quietly amassed one of the most extensive and consistent bodies of research on student loan debt in the United States. Across its twelve regional banks and the Board of Governors in Washington, the Fed has produced a series of studies that track not just the growth of borrowing, but its unequal burden across race, class, institution type, and geography. The findings confirm what many borrowers already know: the promise of higher education increasingly comes with financial risk, social inequality, and personal hardship.
The Fed's research consistently shows that student loan debt limits economic mobility. It lowers homeownership rates, delays marriage and family formation, and contributes to intergenerational poverty—especially among first-generation college students, borrowers of color, and those who attended for-profit or low-value institutions. While college graduates generally earn more over a lifetime than non-graduates, the costs of attendance—and the debt needed to finance it—often erode that advantage.
The New York Fed was among the first to quantify the scale of the crisis. A 2014 staff report revealed the steep growth in borrowing and the rising rates of delinquency. Follow-up research found that students who failed to complete degrees were the most likely to default. Even among those who did graduate, the risks varied widely depending on the school attended. For-profit college students, in particular, had disproportionately poor outcomes—higher debt levels, higher unemployment, and lower earnings.
In New England, the Boston Fed found that despite the region’s high tuition costs, default rates were relatively low. Researchers attributed this to a strong labor market and high levels of family support. But the same studies also showed that borrowers from disadvantaged backgrounds were still more likely to struggle with repayment, even in affluent states.
More recent work from the Federal Reserve Board's Survey of Household Economics and Decisionmaking (SHED) adds further evidence that the student loan crisis is uneven. Black and Latino borrowers were more likely to attend institutions with poor outcomes and were more likely to fall behind on payments after the federal pause ended in 2023. Older Americans, including many Parent PLUS borrowers and returning students, also experienced sharp declines in credit scores when payments resumed.
Other Fed branches have asked deeper structural questions. The Richmond Fed in 2022 examined whether increases in federal loan limits contributed to tuition inflation. Their findings were nuanced: while tuition sometimes rose in tandem with expanded loan access, the relationship was inconsistent and depended heavily on institutional behavior. Meanwhile, the Chicago Fed found that families who lost wealth during the Great Recession relied more heavily on student loans, underscoring that borrowing is often a symptom of broader economic vulnerability, not just tuition hikes.
There are tensions among these findings. Some studies emphasize the long-term value of a college degree, arguing that despite the debt, graduates still fare better than non-graduates. Others focus on the risks—especially for those who never finish or who attend predatory institutions. Some research supports targeted loan forgiveness for the most vulnerable; others point to the need for broader systemic reforms to financing, accountability, and access.
What is clear across all these studies is that the federal student loan system, once designed to expand opportunity, now plays a major role in reproducing inequality. Without deeper changes to how higher education is funded and delivered, student loan debt will continue to act as a drag on economic growth and a burden on the middle and working classes.
Chart: Median Student Loan Balances by Degree Status and Institution Type (Based on data from the Federal Reserve Board’s SHED, 2024)
Degree Completed | Institution Type | Median Balance
---------------------|----------------------|-----------------No Degree | For-Profit College | $15,700
Associate’s Degree | Community College | $12,400
Bachelor’s Degree | Public University | $20,200
Bachelor’s Degree | Private Nonprofit | $26,000
Graduate Degree | Public University | $35,000
Graduate Degree | Private Nonprofit | $49,000
This chart highlights how both degree completion and institution type shape borrowing outcomes. Borrowers with no degree, particularly those who attended for-profit colleges, face high risk with lower earning potential. In contrast, graduate students from private institutions carry the highest debt loads, but typically with greater long-term income.
Sources:
Federal Reserve Board, Survey of Household Economics and Decisionmaking (2014–2024)
New York Federal Reserve, Student Loan Borrowing and Repayment Behavior (2014, 2019)
Boston Federal Reserve, Student Loan Debt and Economic Outcomes in New England (2014, 2016)
Richmond Federal Reserve, Do Federal Student Loans Drive Tuition? (2022)
Chicago Federal Reserve, The Shadow of the Great Recession and Student Loan Burden (2024)
St. Louis Federal Reserve, Students Are Borrowing Too Much—or Too Little (2019)
The US economy expanded at a 3.0 percent annualized rate in the second quarter of 2025, a figure that surprised many analysts following a weak first quarter. But the surface-level recovery masks deeper economic fragility. Much of the Q2 growth was driven by a sharp drop in imports following tariff-related stockpiling earlier in the year. The statistical boost from this reversal, along with modest consumer spending, was enough to produce a positive headline number. Business investment, meanwhile, declined sharply, and real final sales to domestic purchasers rose only 1.2 percent—a better measure of underlying demand.
Donald Trump has wasted little time framing the growth figure as a sign that his policies, particularly tariffs and threats of deregulation, are strengthening the economy. In speeches and media appearances, Trump and his advisors have pointed to the 3 percent growth rate as a vindication of “America First” economic nationalism. But the disconnect between the apparent strength of the economy and its internal weaknesses presents challenges for the Federal Reserve and risks a new phase of politicization of monetary policy.
The Federal Reserve, led by Chair Jerome Powell, is unlikely to change course immediately. Inflation remains above target, and the core of the economy continues to show signs of stagnation. The central bank's dual mandate—price stability and maximum employment—does not support an immediate rate cut, especially with housing costs and services inflation still elevated.
Trump has been openly hostile toward Powell and the Fed's recent decisions to keep interest rates high. He has repeatedly claimed that the central bank is working against his administration and hinted that he would seek significant changes if re-elected. That threat has gained traction among his political allies, some of whom have revived calls to limit the Fed’s independence or reform its structure.
One of the most talked-about possibilities is that Trump could move to replace Powell before his term ends in 2028. While removing a sitting Fed chair is unprecedented and legally questionable, Trump has previously floated this idea and sought alternative paths to reshape the institution. A leading candidate to replace Powell in a second Trump administration is Judy Shelton, a longtime critic of the Federal Reserve and an advocate for a return to a gold standard or a quasi-fixed currency system.
Shelton’s nomination to the Fed board failed in the Senate during Trump’s first term, largely due to concerns about her unorthodox views and perceived lack of commitment to central bank independence. Her statements questioning the Fed’s role as lender of last resort and her support for aligning monetary policy more closely with White House priorities have drawn sharp criticism from economists across the political spectrum. Nonetheless, she has remained a visible figure in conservative monetary policy circles, and her views align with Trump’s desire to exert greater influence over interest rates and financial markets.
Replacing Powell with someone like Shelton would represent a fundamental shift in the Fed’s orientation. It would signal that monetary policy could become more directly shaped by political pressures, particularly during election cycles. Financial markets, already sensitive to signs of instability, would likely respond with volatility. International confidence in the Federal Reserve’s autonomy could weaken, with long-term consequences for the dollar and global capital flows.
The Q2 GDP report, in this context, is less a sign of sustained recovery than it is a flashpoint in an ongoing political struggle over economic governance. The apparent growth has given Trump a short-term rhetorical victory, but the underlying economic challenges remain unresolved. The Fed, for now, continues to operate independently.
Sources
U.S. Bureau of Economic Analysis
Associated Press, July 30, 2025
Barron’s, July 30, 2025
Bloomberg, June 27, 2025
Washington Post, July 30, 2025
Federal Reserve Economic Data (FRED)
Congressional testimony archives on Judy Shelton, 2020–2021
In 1929, when the stock market crashed, millions of Americans were plunged into unemployment, hunger, and despair. Yet the elites of Wall Street—whose reckless speculation fueled the disaster—often landed softly. By 1933, as the Great Depression deepened, nearly a quarter of the U.S. workforce was unemployed, thousands of banks had failed, and working families bore the brunt of the collapse. Ordinary people endured soup lines, Dust Bowl migration, and generational poverty. The government of Franklin D. Roosevelt eventually stepped in with reforms and safeguards like the FDIC and Glass-Steagall, but not before working-class Americans had paid the heaviest price.
Fast forward to 2008, when the global financial system once again teetered on collapse. This time, instead of letting the failures run their course, the U.S. government rushed to bail out Wall Street banks, auto manufacturers, and other corporate giants deemed “too big to fail.” Banks survived, CEOs kept their bonuses, and investors were shielded. Meanwhile, millions of working-class families lost their homes, jobs, and savings. Student loan borrowers, particularly those from working-class and minority backgrounds, never got a bailout. Adjunct faculty, contract workers, and gig laborers were left to navigate economic insecurity without systemic relief.
The pandemic brought the same story in a new form. Corporate bailouts, Federal Reserve interventions, and stimulus packages stabilized markets far more effectively than they stabilized households. Wall Street bounced back faster than Main Street. By 2021, the wealth of America’s billionaires had surged by more than $1.8 trillion, while ordinary workers struggled with eviction threats, childcare crises, and medical debt.
But the stakes are even higher today. U.S. elites are not only repeating past mistakes—they are doubling down on mass speculation across Artificial Intelligence, crypto, real estate, and equity markets. The rise and collapse of speculative cryptocurrencies revealed how wealth can be created and destroyed almost overnight, with everyday investors bearing the losses while venture capitalists and insiders cashed out early. Real estate speculation has driven housing prices beyond the reach of millions of working families, fueling homelessness and displacement. Equity markets, inflated by cheap debt and stock buybacks, have become disconnected from the real economy, rewarding executives while leaving workers behind.
This speculative frenzy is not just an economic issue—it is an environmental one. Artificial Intelligence requires enormous data farms that use lots of energy. Fossil fuel corporations and their financiers continue to reap profits from industries that accelerate climate change, deforestation, and resource depletion. The destruction of ecosystems, the intensification of climate disasters, and the burden of environmental cleanup all fall disproportionately on working-class and marginalized communities. Yet when markets wobble, it is these same polluting elites who position themselves first in line for government protection.
The Federal Reserve has played a decisive role in this cycle. By keeping interest rates artificially low for years, it fueled debt-driven speculation in housing, equities, and corporate borrowing. When inflation spiked, the Fed shifted gears, raising rates at the fastest pace in decades. This brought pain to households through higher mortgage costs, rising credit card balances, and job insecurity—but banks and investment firms continued to receive lifelines through emergency lending facilities. The Fed’s interventions have too often prioritized elite stability over working-class survival.
Political leadership has compounded the problem. Under Donald Trump's first term, deregulation accelerated, with key provisions of the Dodd-Frank Act rolled back in 2018. Banks gained greater leeway to take risks, and oversight of mid-sized institutions weakened—a decision that later contributed to the collapse of Silicon Valley Bank in 2023. Trump’s tax cuts overwhelmingly favored corporations and the wealthy, further concentrating wealth at the top while leaving the federal government less able to respond to future crises. In his second term, Trump and his allies signal that they would pressure the Fed to prioritize markets over workers and strip down remaining regulatory guardrails.
The logic of endless bailouts assumes that the survival of elites ensures the survival of the economy. But history proves otherwise. Whether in 1929, 2008, or 2020, the repeated subsidization of corporations and financial elites entrenches inequality, fuels reckless risk-taking, and leaves working families with the bill. The banks, crypto funds, and private equity firms that profit most during boom times rarely share their gains, yet they demand protection in busts.
And the problem is no longer just domestic—it is geopolitical. While U.S. elites depend on bailouts, rival powers are recalibrating. China is building alternative banking systems through the Asian Infrastructure Investment Bank and the Belt and Road Initiative. Russia, sanctioned by the West, is tightening its economic ties with China and other non-Western states. India and Brazil, key players in the BRICS bloc, are exploring alternatives to U.S. dollar dominance. If the U.S. continues to subsidize private failure with public money, it risks undermining its own global credibility and ceding economic leadership to rivals.
National security is directly tied to economic and environmental stability. A U.S. that repeatedly bails out elites while leaving ordinary citizens vulnerable erodes trust not only at home but abroad. Allies may question American leadership, while adversaries see opportunity in its fragility. If the U.S. financial system is perceived as permanently rigged—propping up elites while disempowering its workforce—it will accelerate the shift of global influence toward China, Russia, India, and Brazil.
Perhaps it’s time to let the system fail—not in the sense of mass suffering for ordinary people, but in the sense of refusing to cushion elites from the consequences of their own decisions. If banks gamble recklessly, let them face bankruptcy. If private equity firms strip-mine industries, let them collapse under their own weight. If universities chase speculative growth with predatory lending and overpriced credentials, let them answer for it in the courts of law and public opinion.
Failure, though painful, can also be cleansing. Without bailouts, institutions would be forced to reckon with structural flaws instead of papering them over. Alternatives could emerge: community-based credit unions, worker-owned cooperatives, public higher education funded for the public good rather than private profit, and serious investment in green energy and sustainable development.
The real question is not whether elites deserve another bailout. The real question is whether the United States can afford to keep subsidizing them while undermining its working class, its environment, and its national security. For too long, workers, students, and families have shouldered the costs of elite failure. The survival of the U.S. economy—and its place in the world—may depend not on saving elites, but on building something stronger and fairer in their place.
Sources:
Congressional Budget Office, The 2008 Financial Crisis and Federal Response
Federal Deposit Insurance Corporation, Bank Failures During the Great Depression
Institute for Policy Studies, Billionaire Wealth Surge During COVID-19
Federal Reserve, Monetary Policy and Emergency Lending Facilities
Brookings Institution, Bailouts and Moral Hazard
BRICS Policy Center, Alternative Financial Governance Structures
[Editor's note: On October 29, 2025, the Higher Education Inquirer emailed South University for a status update. South University did not respond. On November 1, 2025, Benjamin DeGweck replaced Steven Yoho as CEO and Chancellor.]
South University, a former for-profit college network now operating under nonprofit ownership, is facing a$35 million balloon payment this month on a loan obtained through theFederal Reserve’s Main Street Lending Program. The looming debt and the school’s status onHeightened Cash Monitoring (HCM)raise questions about financial stability and the adequacy of regulatory oversight in the nonprofit higher education sector.
A Heavy Loan Load
According to publicly available financial statements, South University carries more than $35 million in long-term debt maturing this month, part of a $50 million Main Street loan issued during the COVID-19 pandemic. The approaching balloon payment represents a major financial test for an institution already under federal scrutiny and struggling with declining enrollment.
Heightened Cash Monitoring—But Limited Oversight
South University is currently listed under Heightened Cash Monitoring (HCM) by the U.S. Department of Education, a status that requires extra documentation before federal aid funds are released. While the designation signals potential financial or compliance issues, it does not necessarily result in strong day-to-day oversight.
The school remains accredited by the Southern Association of Colleges and Schools Commission on Colleges (SACSCOC)—an accreditor known for minimal intervention in institutional finances unless there is clear evidence of collapse. This means that despite the HCM flag, South University continues to operate with significant autonomy, even as federal and student aid dollars flow through additional administrative checks.
A Complicated Legacy
South University’s story is deeply tied to the rise and fall of the for-profit college industry. Once part of Education Management Corporation (EDMC), the school was sold in 2017 to the ill-fated Dream Center Education Holdings (DCEH). When DCEH collapsed in 2019, the Education Principle Foundation (EPF)—a nonprofit—took over South University and The Art Institutes. South University is now an independent non-profit enterprise.
A Pattern of Fragile Conversions
South University’s precarious position reflects a larger trend: the conversion of failing for-profit schools into nominal nonprofits that rely on tuition, federal aid, and private service contracts to survive. These conversions often preserve the same management structures and business practices while benefiting from the public trust and tax advantages of nonprofit status.
The $35 million balloon payment highlights the risks of these financial engineering strategies—especially when public money is involved but public accountability is weak.
What Comes Next
With the 2025 deadline approaching, South University faces a pivotal decision: refinance the Main Street loan, restructure operations, or seek new capital through other partners.
If the institution falters, students could once again be caught in the aftermath of a sector-wide collapse—echoing the failures of EDMC, DCEH, and the Art Institutes.
For now, South University continues to operate with limited transparency, under a light-touch accreditor, and with a multimillion-dollar federal debt hanging over its future.
By 2035, the traditional American college system may be a relic of the past. A variety of forces—economic, technological, demographic, and cultural—are converging to transform the landscape of higher learning. Grounded in Papenhausen's cyclical model of institutional change, current data and trends suggest a plausible future in which college campuses no longer serve as the central hubs of postsecondary education. Instead, a more fragmented, skills-based, and economically integrated system may rise in its place.
Since 2010, college enrollment in the U.S. has declined by 8.5%, with more than a million fewer students than before the COVID-19 pandemic. Over 80 colleges have closed or merged since 2020, and many experts forecast a sharp acceleration in closures, especially as the so-called “demographic cliff” reduces the pool of traditional-age college students. The Federal Reserve Bank of Philadelphia projects a potential 142% increase in annual college closures by the end of the decade.
This institutional unraveling is not solely demographic. Federal disinvestment in research and financial aid, rising tuition (up more than 1,500% since the late 1970s), and increasing underemployment among recent graduates are undermining the perceived and actual value of a college degree. Emerging technologies, particularly AI, are rapidly changing the ways people learn and the skills employers seek. Meanwhile, the proliferation of fake degrees and credential fraud further erodes trust in conventional academic institutions.
In response to these destabilizing trends, four future scenarios offer possible replacements for the traditional college system. Each reflects different combinations of technological advancement, labor market shifts, and institutional evolution.
The Corporate Academy Landscape envisions a future in which large companies like Google, Amazon, and IBM take the lead in educating the workforce. Building on existing certificate programs, these corporations establish their own academies, offering industry-aligned training and credentials. Apprenticeships and on-the-job learning become the primary paths to employment, with digital badges and blockchain-secured micro-credentials replacing degrees. Corporate campuses cluster in major urban centers, while rural areas develop niche training programs related to local industries such as agriculture and renewable energy.
In The Distributed Learning Networks scenario, education becomes fully decentralized. Instead of enrolling in a single institution, learners access personalized instruction through AI-powered platforms, community-based workshops, and online mentorships. Local libraries, maker spaces, and co-working hubs evolve into core educational environments. Learning is assessed through portfolios and real-world projects rather than grades or standardized exams. Regional expertise clusters develop organically, especially in smaller cities and towns with existing community infrastructure.
The Guild Renaissance looks to the past to shape the future. Modeled on pre-industrial apprenticeship systems, professional guilds re-emerge as gatekeepers of career development. These organizations handle training, credentialing, and job placement in sectors such as healthcare, construction, technology, and the arts. Hierarchical systems guide individuals from novice to expert, and regional economies specialize around guild-supported industries. Employment becomes tightly integrated with ongoing learning, minimizing the traditional gap between school and work.
Finally, The Hybrid Workplace University scenario grows out of the shift to remote and hybrid work. With more than one-third of workers expected to remain partially remote, workplaces themselves become learning environments. Education is embedded in professional workflows through VR training, modular courses, and flexible scheduling. As access to learning becomes geographically unrestricted, rural and underpopulated areas may see renewed vitality as remote workers seek lower-cost, higher-quality living environments.
Despite their differences, these scenarios share several transformational themes. Economically, resources formerly directed toward campus infrastructure are redirected toward skills training, research hubs, and community development. Culturally, the notion of lifelong learning becomes normalized, and credentials become more transparent, practical, and verifiable. Socially, traditional notions of campus life give way to professional and civic identity tied to industry specialization or community engagement.
The evolution of quality assurance is also noteworthy. Traditional accreditation may give way to employer-driven standards, market-based performance indicators, and digital verification technologies. Blockchain and competency-based evaluations offer more direct and trustworthy assessments of ability and readiness for employment.
Geographically, these changes will reshape communities in different ways. Former college towns must navigate economic transitions, potentially reinventing themselves as hubs for innovation or remote work. Urban areas may thrive as centers of corporate education and research. Rural regions may find new purpose through specialized training programs aligned with local resources and culture.
If these trends continue, the benefits could be substantial: reduced student debt, more direct paths to employment, faster innovation, and greater regional economic diversity. But challenges remain. The loss of traditional university research infrastructure may hinder long-term scientific progress. Access to elite training may increasingly depend on corporate affiliation, potentially limiting social mobility and excluding those without early access to professional networks. The liberal arts and humanities—once central to American higher education—may struggle to find footing in this new paradigm.
In the broad view, these emerging models reflect a shift away from institutional prestige and toward demonstrable competence. The change is not only educational but societal, redefining what it means to learn, to work, and to belong. Whether this transformation leads to a more inclusive and efficient system or deepens existing inequities will depend on how these new models are regulated, supported, and adapted to public needs.
By 2035, the American educational system may no longer be anchored to age-segregated campuses and debt-financed degrees. Instead, it may revolve around pragmatic, lifelong pathways—deeply integrated with the labor market, shaped by regional strengths, and responsive to continuous technological change.
Sources:
National Student Clearinghouse Research Center
U.S. Department of Education
Federal Reserve Bank of Philadelphia
4–5. National Center for Education Statistics
6–9. Bureau of Labor Statistics, Consumer Price Index
10–11. Federal Reserve Bank of New York
12–13. McKinsey & Co., World Economic Forum
14–16. U.S. Department of Justice, Accrediting Agencies
17–19. Company Reports (Google, IBM, Amazon, Apple)
20–21. U.S. Department of Labor
22–24. Credential Engine, World Bank, Blockchain in Education Conference
Burning Glass Institute
26–29. EdTech Reports, OECD, Pew Research Center
30–31. National Apprenticeship Survey
32–34. Gallup, Stanford Remote Work Project
It appears we have entered a new phase of Academic Capitalism and the College Meltdown. The previous phase involved College Mania! and the growth of the "educated underclass" (including gig workers, adjuncts and postdocs), Wall Street over-speculation, the divestment of corporations from employee benefits, and the rise and fall of for-profit colleges: Corinthian Colleges, ITT Tech, Education Management Corporation, Apollo Group, Education Corporation of America, and Laureate Education.
Enrollment at proprietary schools is down about 40 percent from its peak in 2010 and higher education enrollment has dropped every year for the last decade. In absolute numbers, community colleges have taken the largest hit. Regional public universities have also experienced large enrollment declines.
At other schools, student aid has shifted from "needs based" to "merit based" making college choice for low- and moderate income families an even riskier choice.
Student loan debt has crippled millions of working families, but neoliberal experts at Goldman Sachs and the Federal Reserve do not see a significant problem.
According to the Federal Reserve, the student debt problem is ameliorated by the decline in births to people of lower socio-economic status. The FED has also consistently reported that the debt is not a huge drag on the economy (less than 0.05 percent per year). Those developments, along with an anemic but growing student debt movement, have meant that the chance for progressive and meaningful change is limited under the Biden administration, but possible in the long run.
This new phase of the College Meltdown has strong roots in the 1980s and involves the continued growth of the educated underclass (including elite overproduction in higher education) and more bulls*t jobs, the privatization of public higher education, the proliferation and consolidation of online program managers (OPMs) working for name brand and lesser known schools, non-profit subprime colleges, robocolleges, continued grade inflation, and the fall of the US federal student loan program. In 2020 and 2021, higher education also received three massive federal bailouts.
Larger developments include the resurgence of authoritarianism, the hollowing out of America, and the global climate change crisis.Despite these glaring existential problems, a looming college enrollment cliff in 2026, and growing dismay by working families, irrational exuberance and false optimism continues among most college business officers and middle-class consumers.
Will austerity and excesses in the system lead to even more dramatic failures? Will the states and federal government ask for more transparency and accountability of the government funds that keep the system afloat?
What should we be observing in this new phase:
1. The growth (and power) of the "educated underclass"
2. The effects of student loan debt on working families and social institutions (including religion and the economy)
4. The health of the US Department of Education's Student Loan Portfolio
5. The growth of Online Program Managers
6. The degree that public universities are serving their citizens
7. The amount of money spent on marketing and advertising in higher education
8. Analyses of the FED, big banks, and rating agencies about the K-12 pipeline, higher education, student loan debt, and the growth of the educated underclass
9. Local, state, and federal responses to "savage inequalities" in the K-12 pipeline, student loan debt, and the growth of the "educated underclass"
10. The rise of authoritarianism/neofascism in US education and the US as a whole (e.g. mass surveillance, anti-intellectualism, hate crimes)
11. In deference to Bryan Alexander and his upcoming book "Universities on Fire" I must include global climate change as a phenomenon that must be observed and dealt with. Failure to address this existential problem makes the other issues irrelevant.
This article was updated November 11, 2021 to include a link to elite overproduction in higher education and on January 26, 2022 to include a list of recent references.
When
borrowers default on their federal student loans, the U.S. Department
of Education (“Department of Education”) can collect the outstanding
balance through forced collections, including the offset of tax refunds
and Social Security benefits and the garnishment of wages. At the
beginning of the COVID-19 pandemic, the Department of Education paused
collections on defaulted federal student loans.1
This year, collections are set to resume and almost 6 million student
loan borrowers with loans in default will again be subject to the
Department of Education’s forced collection of their tax refunds, wages,
and Social Security benefits.2
Among the borrowers who are likely to experience forced collections are
an estimated 452,000 borrowers ages 62 and older with defaulted loans
who are likely receiving Social Security benefits.3
This
spotlight describes the circumstances and experiences of student loan
borrowers affected by the forced collection of Social Security benefits.4
It also describes how forced collections can push older borrowers into
poverty, undermining the purpose of the Social Security program.5
Key findings
The
number of Social Security beneficiaries experiencing forced collection
grew by more than 3,000 percent in fewer than 20 years; the count is
likely to grow as the age of student loan borrowers trends older.
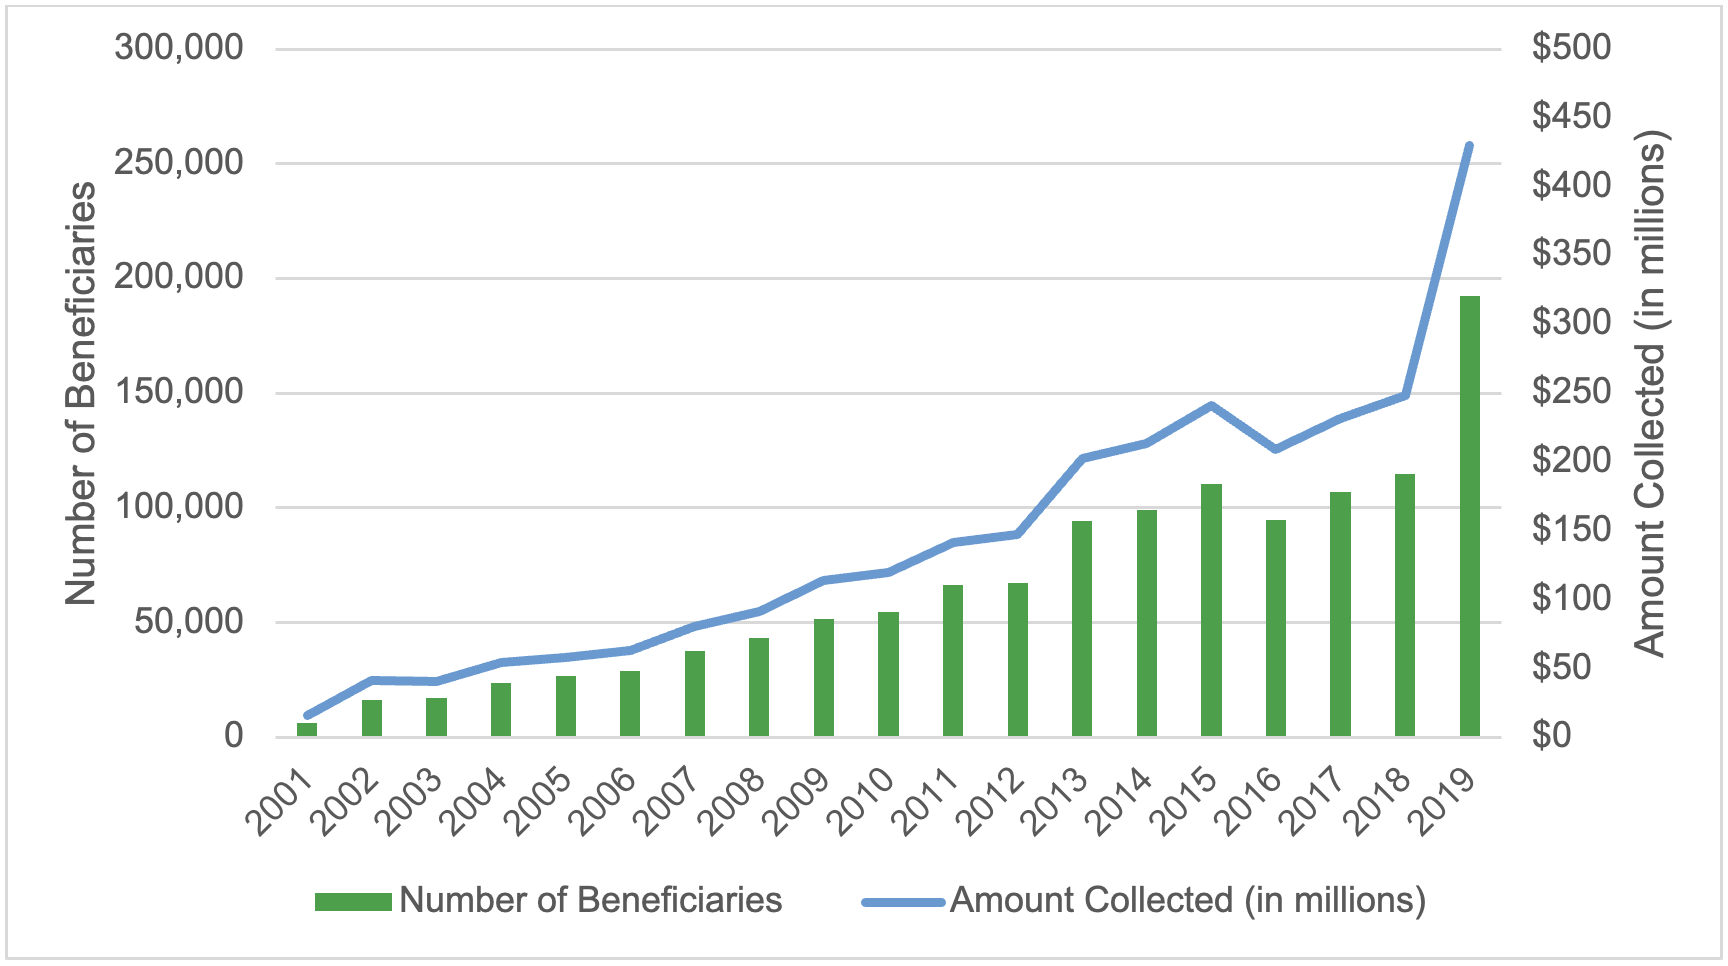
Between 2001 and 2019, the number of Social Security beneficiaries
experiencing reduced benefits due to forced collection increased from
approximately 6,200 to 192,300. This exponential growth is likely driven
by older borrowers who make up an increasingly large share of the
federal student loan portfolio. The number of student loan borrowers
ages 62 and older increased by 59 percent from 1.7 million in 2017 to
2.7 million in 2023, compared to a 1 percent decline among borrowers
under the age of 62.
The total amount
of Social Security benefits the Department of Education collected
between 2001 and 2019 through the offset program increased from $16.2
million to $429.7 million. Despite the exponential increase in
collections from Social Security, the majority of money the Department
of Education has collected has been applied to interest and fees and has
not affected borrowers’ principal amount owed. Furthermore, between
2016 and 2019, the Department of the Treasury’s fees alone accounted for
nearly 10 percent of the average borrower’s lost Social Security
benefits.
More than one in three
Social Security recipients with student loans are reliant on Social
Security payments, meaning forced collections could significantly
imperil their financial well-being. Approximately 37 percent of the
1.3 million Social Security beneficiaries with student loans rely on
modest payments, an average monthly benefit of $1,523, for 90 percent of
their income. This population is particularly vulnerable to reduction
in their benefits especially if benefits are offset year-round. In 2019,
the average annual amount collected from individual beneficiaries was
$2,232 ($186 per month).
The physical well-being of half of Social Security beneficiaries with student loans in default may be at risk.
Half of Social Security beneficiaries with student loans in default and
collections skipped a doctor’s visit or did not obtain prescription
medication due to cost.
Existing minimum income protections fail to protect student loan borrowers with Social Security against financial hardship.
Currently, only $750 per month of Social Security income—an amount that
is $400 below the monthly poverty threshold for an individual and has
not been adjusted for inflation since 1996—is protected from forced
collections by statute. Even if the minimum protected income was
adjusted for inflation, beneficiaries would likely still experience
hardship, such as food insecurity and problems paying utility bills. A
higher threshold could protect borrowers against hardship more
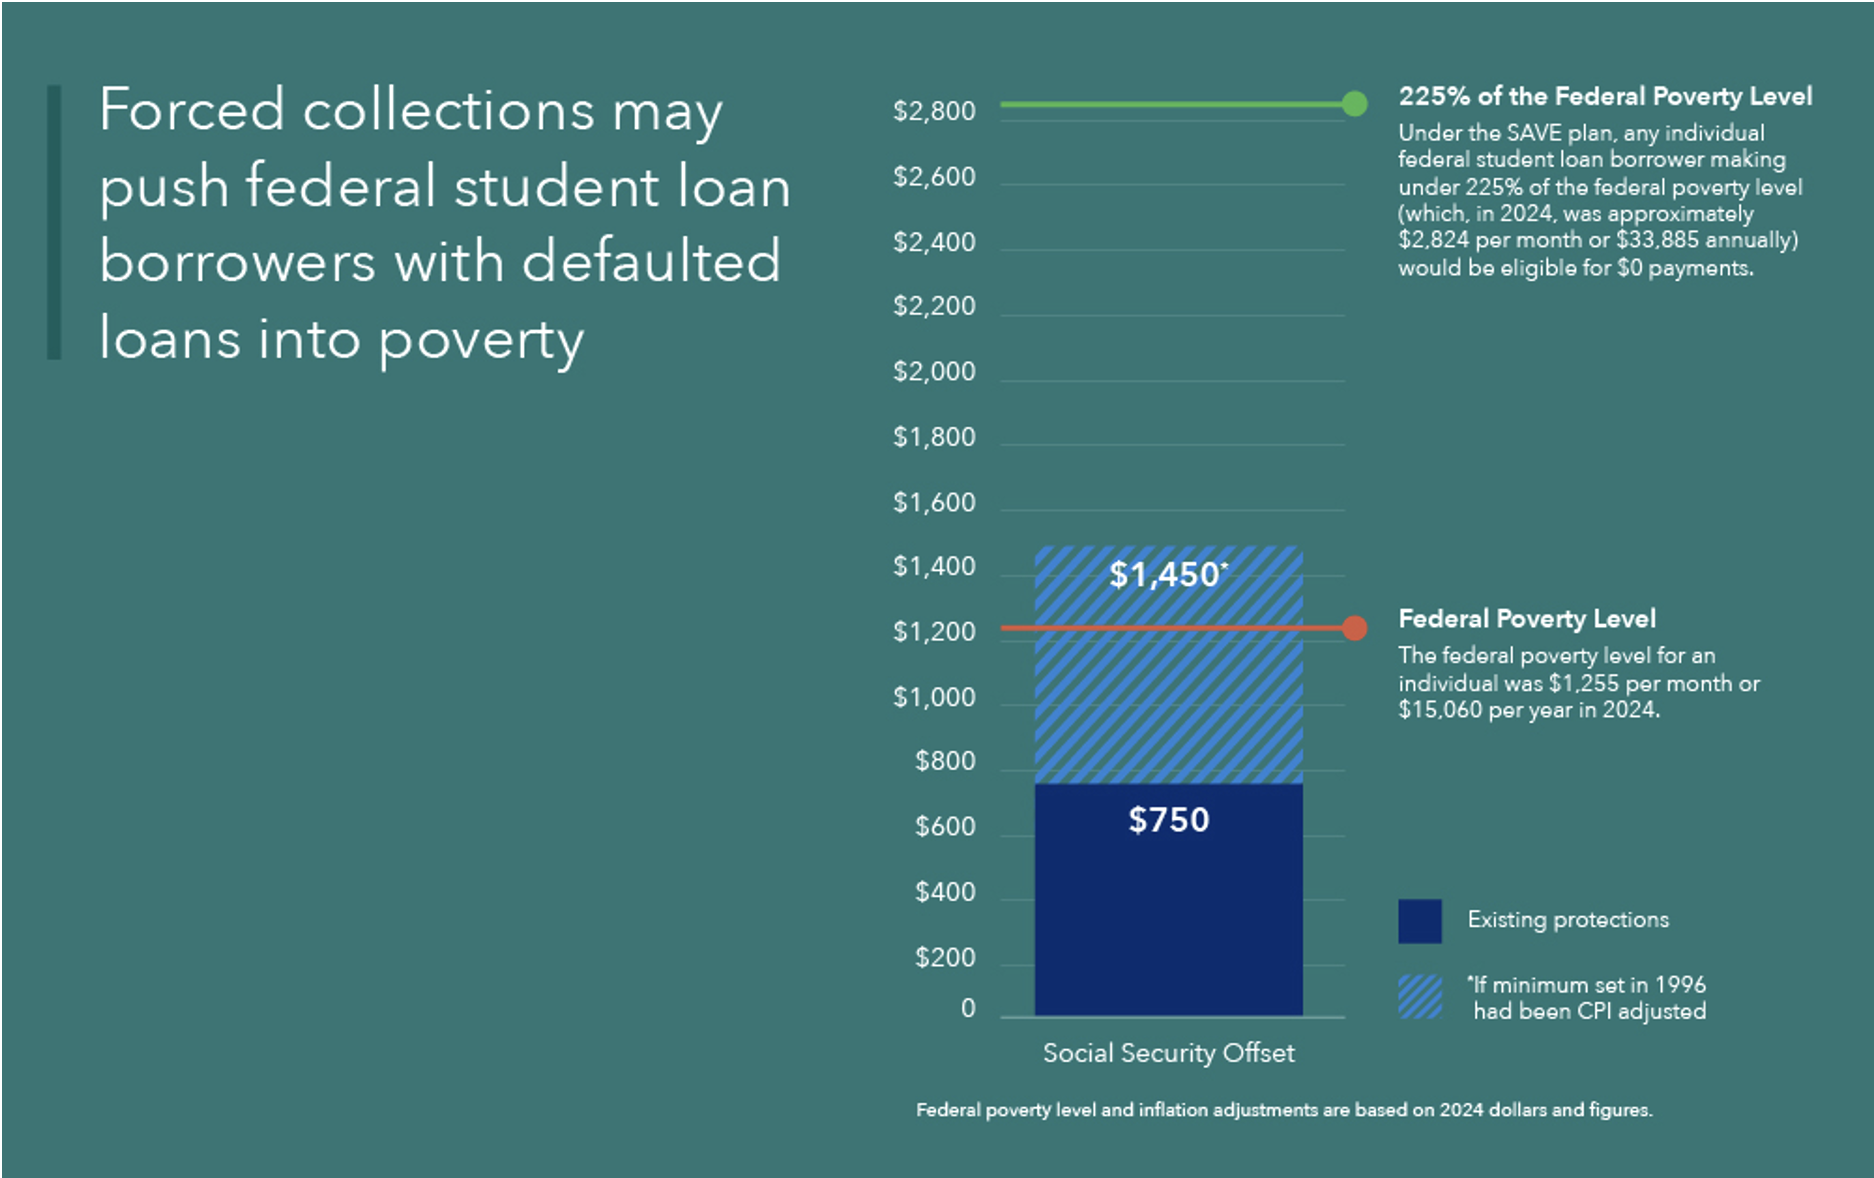
effectively. The CFPB found that for 87 percent of student loan
borrowers who receive Social Security, their benefit amount is below 225
percent of the federal poverty level (FPL), an income level at which
people are as likely to experience material hardship as those with
incomes below the federal poverty level.
Large
shares of Social Security beneficiaries affected by forced collections
may be eligible for relief or outright loan cancellation, yet they are
unable to access these benefits, possibly due to insufficient
automation or borrowers’ cognitive and physical decline. As many as
eight in ten Social Security beneficiaries with loans in default may be
eligible to suspend or reduce forced collections due to financial
hardship. Moreover, one in five Social Security beneficiaries may be
eligible for discharge of their loans due to a disability. Yet these
individuals are not accessing such relief because the Department of
Education’s data matching process insufficiently identifies those who
may be eligible.
Taken together,
these findings suggest that the Department of Education’s forced
collections of Social Security benefits increasingly interfere with
Social Security’s longstanding purpose of protecting its beneficiaries
from poverty and financial instability.
Introduction
When
borrowers default on their federal student loans, the Department of
Education can collect the outstanding balance through forced
collections, including the offset of tax refunds and Social Security
benefits, and the garnishment of wages. At the beginning of the COVID-19
pandemic, the Department of Education paused collections on defaulted
federal student loans. This year, collections are set to resume and
almost 6 million student loan borrowers with loans in default will again
be subject to the Department of Education’s forced collection of their
tax refunds, wages, and Social Security benefits.6
Among
the borrowers who are likely to experience the Department of
Education’s renewed forced collections are an estimated 452,000
borrowers with defaulted loans who are ages 62 and older and who are
likely receiving Social Security benefits.7
Congress created the Social Security program in 1935 to provide a basic
level of income that protects insured workers and their families from
poverty due to situations including old age, widowhood, or disability.8
The Social Security Administration calls the program “one of the most
successful anti-poverty programs in our nation's history.”9
In 2022, Social Security lifted over 29 million Americans from poverty,
including retirees, disabled adults, and their spouses and dependents.10
Congress has recognized the importance of securing the value of Social
Security benefits and on several occasions has intervened to protect
them.11
This
spotlight describes the circumstances and experiences of student loan
borrowers affected by the forced collection of their Social Security
benefits.12
It also describes how the purpose of Social Security is being
increasingly undermined by the limited and deficient options the
Department of Education has to protect Social Security beneficiaries
from poverty and hardship.
The forced collection of Social Security benefits has increased exponentially.
Federal
student loans enter default after 270 days of missed payments and
transfer to the Department of Education’s default collections program
after 360 days. Borrowers with a loan in default face several
consequences: (1) their credit is negatively affected; (2) they lose
eligibility to receive federal student aid while their loans are in
default; (3) they are unable to change repayment plans and request
deferment and forbearance;13 and (4) they face forced collections of tax refunds, Social Security benefits, and wages among other payments.14
To conduct its forced collections of federal payments like tax refunds
and Social Security benefits, the Department of Education relies on a
collection service run by the U.S. Department of the Treasury called the
Treasury Offset Program.15
Between
2001 and 2019, the number of student loan borrowers facing forced
collection of their Social Security benefits increased from at least
6,200 to 192,300.16
That is a more than 3,000 percent increase in fewer than 20 years. By
comparison, the number of borrowers facing forced collections of their
tax refunds increased by about 90 percent from 1.17 million to 2.22
million during the same period.17
This exponential growth of Social Security offsets between 2001 and 2019 is likely driven by multiple factors including:
Older
borrowers accounted for an increasingly large share of the federal
student loan portfolio due to increasing average age of enrollment and
length of time in repayment. Data from the Department of Education
(which is only available since 2017), show that the number of student
loan borrowers ages 62 and older, increased 24 percent from 1.7 million
in 2017 to 2.1 million in 2019, compared to less than 1 percent among
borrowers under the age of 62.18
A larger number of borrowers, especially older borrowers, had loans in default.
Data from the Department of Education show that the number of student
loan borrowers with a defaulted loan increased by 230 percent from 3.8
million in 2006 to 8.8 million in 2019.19 Compounding these trends is the fact that older borrowers are twice as likely to have a loan in default than younger borrowers.20
Due
to these factors, the total amount of Social Security benefits the
Department of Education collected between 2001 and 2019 through the
offset program increased annually from $16.2 million to $429.7 million
(when adjusted for inflation).21
This increase occurred even though the average monthly amount the
Department of Education collected from individual beneficiaries was the
same for most years, at approximately $180 per month.22
Figure 1: Number of Social Security beneficiaries and total amount collected for student loans (2001-2019)
Source: CFPB analysis of public data from U.S. Treasury’s Fiscal Data portal. Amounts are presented in 2024 dollars.
While the total collected from
Social Security benefits has increased exponentially, the majority of
money the Department of Education collected has not been applied to
borrowers’ principal amount owed. Specifically, nearly three-quarters of
the monies the Department of Education collects through offsets is
applied to interest and fees, and not towards paying down principal
balances.23
Between 2016 and 2019, the U.S. Department of the Treasury charged the
Department of Education between $13.12 and $15.00 per Social Security
offset, or approximately between $157.44 and $180 for 12 months of
Social Security offsets per beneficiary with defaulted federal student
loans.24 As a matter of practice, the Department of Education often passes these fees on directly to borrowers.25
Furthermore, these fees accounted for nearly 10 percent of the average
monthly borrower’s lost Social Security benefits which was $183 during
this time.26
Interest and fees not only reduce beneficiaries’ monthly benefits, but
also prolong the period that beneficiaries are likely subject to forced
collections.
Forced collections are compromising Social Security beneficiaries’ financial well-being.
Forced
collection of Social Security benefits affects the financial well-being
of the most vulnerable borrowers and can exacerbate any financial and
health challenges they may already be experiencing. The CFPB’s analysis
of the Survey of Income and Program Participation (SIPP) pooled data for
2018 to 2021 finds that Social Security beneficiaries with student
loans receive an average monthly benefit of $1,524.27
The analysis also indicates that approximately 480,000 (37 percent) of
the 1.3 million beneficiaries with student loans rely on these modest
payments for 90 percent or more of their income,28
thereby making them particularly vulnerable to reduction in their
benefits especially if benefits are offset year-round. In 2019, the
average annual amount collected from individual beneficiaries was $2,232
($186 per month).29
A
recent survey from The Pew Charitable Trusts found that more than nine
in ten borrowers who reported experiencing wage garnishment or Social
Security payment offsets said that these penalties caused them financial
hardship.30
Consequently, for many, their ability to meet their basic needs,
including access to healthcare, became more difficult. According to our
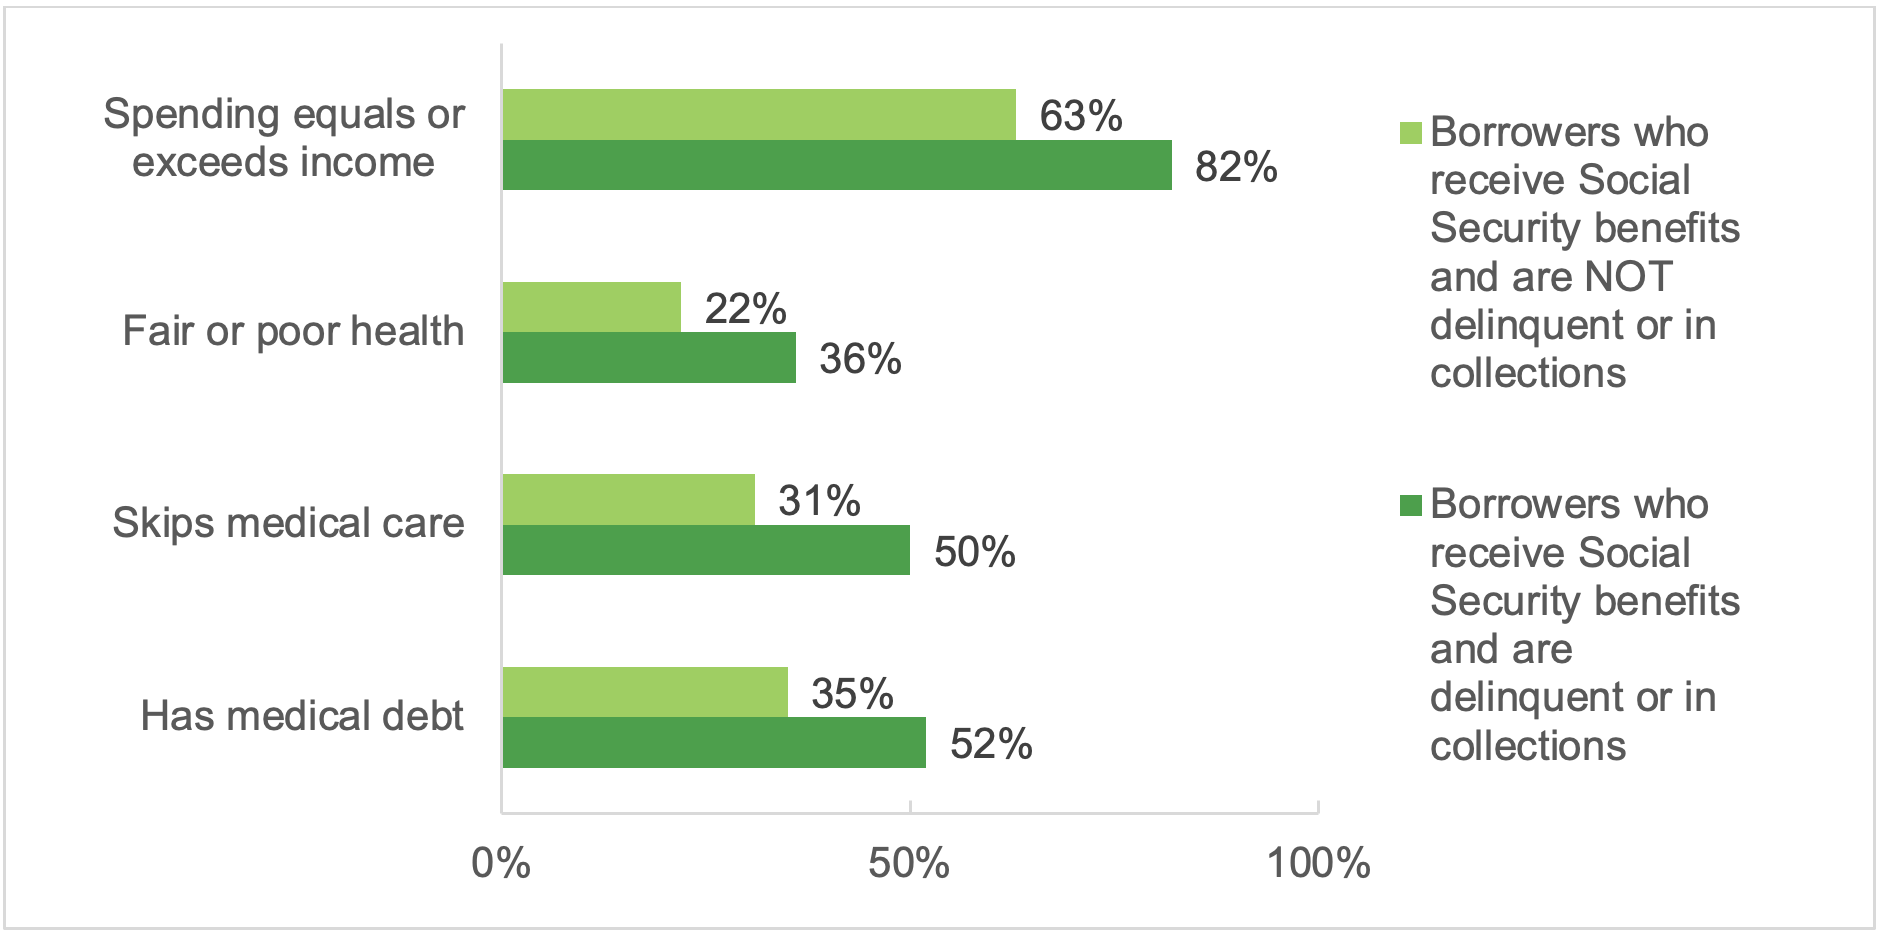
analysis of the Federal Reserve’s Survey of Household Economic and
Decision-making (SHED), half of Social Security beneficiaries with
defaulted student loans skipped a doctor’s visit and/or did not obtain
prescription medication due to cost.31
Moreover, 36 percent of Social Security beneficiaries with loans in
delinquency or in collections report fair or poor health. Over half of
them have medical debt.32
Figure 2: Selected financial experiences and hardships among subgroups of loan borrowers
Source: CFPB analysis of the Federal Reserve Board Survey of Household Economic and Decision-making (2019-2023).
Social Security recipients
subject to forced collection may not be able to access key public
benefits that could help them mitigate the loss of income. This is
because Social Security beneficiaries must list the unreduced amount of
their benefits prior to collections when applying for other means-tested
benefits programs such as Social Security Insurance (SSI), Supplemental
Nutrition Assistance Program (SNAP), and the Medicare Savings Programs.33
Consequently, beneficiaries subject to forced collections must report
an inflated income relative to what they are actually receiving. As a
result, these beneficiaries may be denied public benefits that provide
food, medical care, prescription drugs, and assistance with paying for
other daily living costs.34
Consumers’
complaints submitted to the CFPB describe the hardship caused by forced
collections on borrowers reliant on Social Security benefits to pay for
essential expenses.35
Consumers often explain their difficulty paying for such expenses as
rent and medical bills. In one complaint, a consumer noted that they
were having difficulty paying their rent since their Social Security
benefit usually went to paying that expense.36
In another complaint, a caregiver described that the money was being
withheld from their mother’s Social Security, which was the only source
of income used to pay for their mother’s care at an assisted living
facility.37
As forced collections threaten the housing security and health of
Social Security beneficiaries, they also create a financial burden on
non-borrowers who help address these hardships, including family members
and caregivers.
Existing minimum income protections fail to protect student loan borrowers with Social Security against financial hardship.
The
Debt Collection Improvement Act set a minimum floor of income below
which the federal government cannot offset Social Security benefits and
subsequent Treasury regulations established a cap on the percentage of
income above that floor.38
Specifically, these statutory guardrails limit collections to 15
percent of Social Security benefits above $750. The minimum threshold
was established in 1996 and has not been updated since. As a result, the
amount protected by law alone does not adequately protect beneficiaries
from financial hardship and in fact no longer protects them from
falling below the federal poverty level (FPL). In 1996, $750 was nearly
$100 above the monthly poverty threshold for an individual.39
Today that same protection is $400 below the threshold. If the
protected amount of $750 per month ($9,000 per year) set in 1996 was
adjusted for inflation, in 2024 dollars, it would total $1,450 per month
($17,400 per year).40
Figure
3: Comparison of monthly FPL threshold with the current protected
amount established in 1996 and the amount that would be protected with
inflation adjustment
Source: Calculations by the CFPB. Notes: Inflation adjustments based on the consumer price index (CPI).
Even if the minimum protected
income of $750 is adjusted for inflation, beneficiaries will likely
still experience hardship as a result of their reduced benefits.
Consumers with incomes above the poverty line also commonly experience
material hardship.41 This suggests that a threshold that is higher than the poverty level will more effectively protect against hardship.42
Indeed, in determining an income threshold for $0 payments under the
SAVE plan, the Department of Education researchers used material
hardship (defined as being unable to pay utility bills and reporting
food insecurity) as their primary metric, and found similar levels of
material hardship among those with incomes below the poverty line and
those with incomes up to 225 percent of the FPL.43
Similarly, the CFPB’s analysis of a pooled sample of SIPP respondents
finds the same levels of material hardship for Social Security
beneficiaries with student loans with incomes below 100 percent of the
FPL and those with incomes up to 225 percent of the FPL.44
The CFPB found that for 87 percent of student loan borrowers who
receive Social Security, their benefit amount is below 225 percent of
the FPL.45
Accordingly, all of those borrowers would be removed from forced
collections if the Department of Education applied the same income
metrics it established under the SAVE program to an automatic hardship
exemption program.
Existing options for relief from forced collections fail to reach older borrowers.
Borrowers
with loans in default remain eligible for certain types of loan
cancellation and relief from forced collections. However, our analysis
suggests that these programs may not be reaching many eligible
consumers. When borrowers do not benefit from these programs, their
hardship includes, but is not limited to, unnecessary losses to their
Social Security benefits and negative credit reporting.
Borrowers who become disabled after reaching full retirement age may miss out on Total and Permanent Disability
The
Total and Permanent Disability (TPD) discharge program cancels federal
student loans and effectively stops all forced collections for disabled
borrowers who meet certain requirements. After recent revisions to the
program, this form of cancelation has become common for those borrowers
with Social Security who became disabled prior to full retirement age.46 In 2016, a GAO study documented the significant barriers to TPD that Social Security beneficiaries faced.47
To address GAO’s concerns, the Department of Education in 2021 took a
series of mitigating actions, including entering into a data-matching
agreement with the Social Security Administration (SSA) to automate the
TPD eligibility determination and discharge process.48
This process was expanded further with new final rules being
implemented July 1, 2023 that expanded the categories of borrowers
eligible for automatic TPD cancellation.49 In total, these changes successfully resulted in loan cancelations for approximately 570,000 borrowers.50
However,
the automation and other regulatory changes did not significantly
change the application process for consumers who become disabled after
they reach full retirement age or who have already claimed the Social
Security retirement benefits. For these beneficiaries, because they are
already receiving retirement benefits, SSA does not need to determine
disability status. Likewise, SSA does not track disability status for
those individuals who become disabled after they start collecting their
Social Security retirement benefits.51
Consequently,
SSA does not transfer information on disability to the Department of
Education once the beneficiary begins collecting Social Security
retirement.52
These individuals therefore will not automatically get a TPD discharge
of their student loans, and they must be aware and physically and
mentally able to proactively apply for the discharge.53
The
CFPB’s analysis of the Census survey data suggests that the population
that is excluded from the TPD automation process could be substantial.
More than one in five (22 percent) Social Security beneficiaries with
student loans are receiving retirement benefits and report a disability
such as a limitation with vision, hearing, mobility, or cognition.54
People with dementia and other cognitive disabilities are among those
with the greatest risk of being excluded, since they are more likely to
be diagnosed after the age 70, which is the maximum age for claiming
retirement benefits.55
These
limitations may also help explain why older borrowers are less likely
to rehabilitate their defaulted student loans. Specifically, 11 percent
of student loan borrowers ages 50 to 59 facing forced collections
successfully rehabilitated their loans,56 while only five percent of borrowers over the age of 75 do so.57
Figure
4: Number of student loan borrowers ages 50 and older in forced
collection, borrowers who signed a rehabilitation agreement, and
borrowers who successfully rehabilitated a loan by selected age groups
Age Group
Number of Borrowers in Offset
Number of Borrowers Who Signed a Rehabilitation Agreement
Percent of Borrowers Who Signed a Rehabilitation Agreement
Number of Borrowers Successfully Rehabilitated
Percent of Borrowers who Successfully Rehabilitated
50 to 59
265,200
50,800
14%
38,400
11%
60 to 74
184,900
24,100
11%
18,500
8%
75 and older
15,800
1,000
6%
800
5%
Source: CFPB analysis of data provided by the Department of Education.
Shifting demographics of
student loan borrowers suggest that the current automation process may
become less effective to protect Social Security benefits from forced
collections as more and more older adults have student loan debt. The
fastest growing segment of student loan borrowers are adults ages 62 and
older. These individuals are generally eligible for retirement
benefits, not disability benefits, because they cannot receive both
classifications at the same time. Data from the Department of Education
reflect that the number of student loan borrowers ages 62 and older
increased by 59 percent from 1.7 million in 2017 to 2.7 million in 2023.
In comparison, the number of borrowers under the age of 62 remained
unchanged at 43 million in both years.58
Furthermore, additional data provided to the CFPB by the Department of
Education show that nearly 90,000 borrowers ages 81 and older hold an
average amount of $29,000 in federal student loan debt, a substantial
amount despite facing an estimated average life expectancy of less than
nine years.59
Existing exceptions to forced collections fail to protect many Social Security beneficiaries
In
addition to TPD discharge, the Department of Education offers reduction
or suspension of Social Security offset where borrowers demonstrate
financial hardship.60
To show hardship, borrowers must provide documentation of their income
and expenses, which the Department of Education then uses to make its
determination.61
Unlike the Debt Collection Improvement Act’s minimum protections, the
eligibility for hardship is based on a comparison of an individual’s
documented income and qualified expenses. If the borrower has eligible
monthly expenses that exceed or match their income, the Department of
Education then grants a financial hardship exemption.62
The
CFPB’s analysis suggests that the vast majority of Social Security
beneficiaries with student loans would qualify for a hardship
protection. According to CFPB’s analysis of the Federal Reserve Board’s
SHED, eight in ten (82 percent) of Social Security beneficiaries with
student loans in default report that their expenses equal or exceed
their income.63
Accordingly, these individuals would likely qualify for a full
suspension of forced collections. Yet the GAO found that in 2015 (when
the last data was available) less than ten percent of Social Security
beneficiaries with forced collections applied for a hardship exemption
or reduction of their offset.64
A possible reason for the low uptake rate is that many beneficiaries or
their caregivers never learn about the hardship exemption or the
possibility of a reduction in the offset amount.65
For those that do apply, only a fraction get relief. The GAO study
found that at the time of their initial offset, only about 20 percent of
Social Security beneficiaries ages 50 and older with forced collections
were approved for a financial hardship exemption or a reduction of the
offset amount if they applied.66
Conclusion
As
hundreds of thousands of student loan borrowers with loans in default
face the resumption of forced collection of their Social Security
benefits, this spotlight shows that the forced collection of Social
Security benefits causes significant hardship among affected borrowers.
The spotlight also shows that the basic income protections aimed at
preventing poverty and hardship among affected borrowers have become
increasingly ineffective over time. While the Department of Education
has made some improvements to expand access to relief options,
especially for those who initially receive Social Security due to a
disability, these improvements are insufficient to protect older adults
from the forced collection of their Social Security benefits.
Taken
together, these findings suggest that forced collections of Social
Security benefits increasingly interfere with Social Security’s
longstanding purpose of protecting its beneficiaries from poverty and
financial instability. These findings also suggest that alternative
approaches are needed to address the harm that forced collections cause
on beneficiaries and to compensate for the declining effectiveness of
existing remedies. One potential solution may be found in the Debt
Collection Improvement Act, which provides that when forced collections
“interfere substantially with or defeat the purposes of the payment
certifying agency’s program” the head of an agency may request from the
Secretary of the Treasury an exemption from forced collections.67
Given the data findings above, such a request for relief from the
Commissioner of the Social Security Administration on behalf of Social
Security beneficiaries who have defaulted student loans could be
justified. Unless the toll of forced collections on Social Security
beneficiaries is considered alongside the program’s stated goals, the
number of older adults facing these challenges is only set to grow.
Data and Methodology
To
develop this report, the CFPB relied primarily upon original analysis
of public-use data from the U.S. Census Bureau Survey of Income and
Program Participation (SIPP), the Federal Reserve Board Board’s Survey
of Household Economics and Decision-making (SHED), U.S. Department of
the Treasury, Fiscal Data portal, consumer complaints received by the
Bureau, and administrative data on borrowers in default provided by the
Department of Education. The report also leverages data and findings
from other reports, studies, and sources, and cites to these sources
accordingly. Readers should note that estimates drawn from survey data
are subject to measurement error resulting, among other things, from
reporting biases and question wording.
Survey of Income and Program Participation
The
Survey of Income and Program Participation (SIPP) is a nationally
representative survey of U.S. households conducted by the U.S. Census
Bureau. The SIPP collects data from about 20,000 households (40,000
people) per wave. The survey captures a wide range of characteristics
and information about these households and their members. The CFPB
relied on a pooled sample of responses from 2018, 2019, 2020, and 2021
waves for a total number of 17,607 responses from student loan borrowers
across all waves, including 920 respondents with student loans
receiving Social Security benefits. The CFPB’s analysis relied on the
public use data. To capture student loan debt, the survey asked to all
respondents (variable EOEDDEBT): Owed any money for student loans or
educational expenses in own name only during the reference period. To
capture receipt of Social Security benefits, the survey asked to all
respondents (variable ESSSANY): “Did ... receive Social Security
benefits for himself/herself at any time during the reference period?”
To capture amount of Social Security benefits, the survey asked to all
respondents (variable TSSSAMT): “How much did ... receive in Social
Security benefit payment in this month (1-12), prior to any deductions
for Medicare premiums?”
The
Federal Reserve Board’s Survey of Household Economics and
Decision-making (SHED) is an annual web-based survey of households. The
survey captures information about respondents’ financial situations. The
CFPB relied on a pooled sample of responses from 2019 through 2023
waves for a total number of 1,376 responses from student loan borrowers
in collection across all waves. The CFPB analysis relied on the public
use data. To capture default and collection, the survey asked all
respondents with student loans (variable SL6): “Are you behind on
payments or in collections for one or more of the student loans from
your own education?” To capture receipt of Social Security benefits, the
survey asked to all respondents (variable I0_c): “In the past 12
months, did you (and/or your spouse or partner) receive any income from
the following sources: Social Security (including old age and DI)?”